Plans & Pricing
(Monthly)
| Plans | ||||
|---|---|---|---|---|
|
Starter
$29
|
Lite
$99
|
Pro
$249
|
Creator
$349
|
|
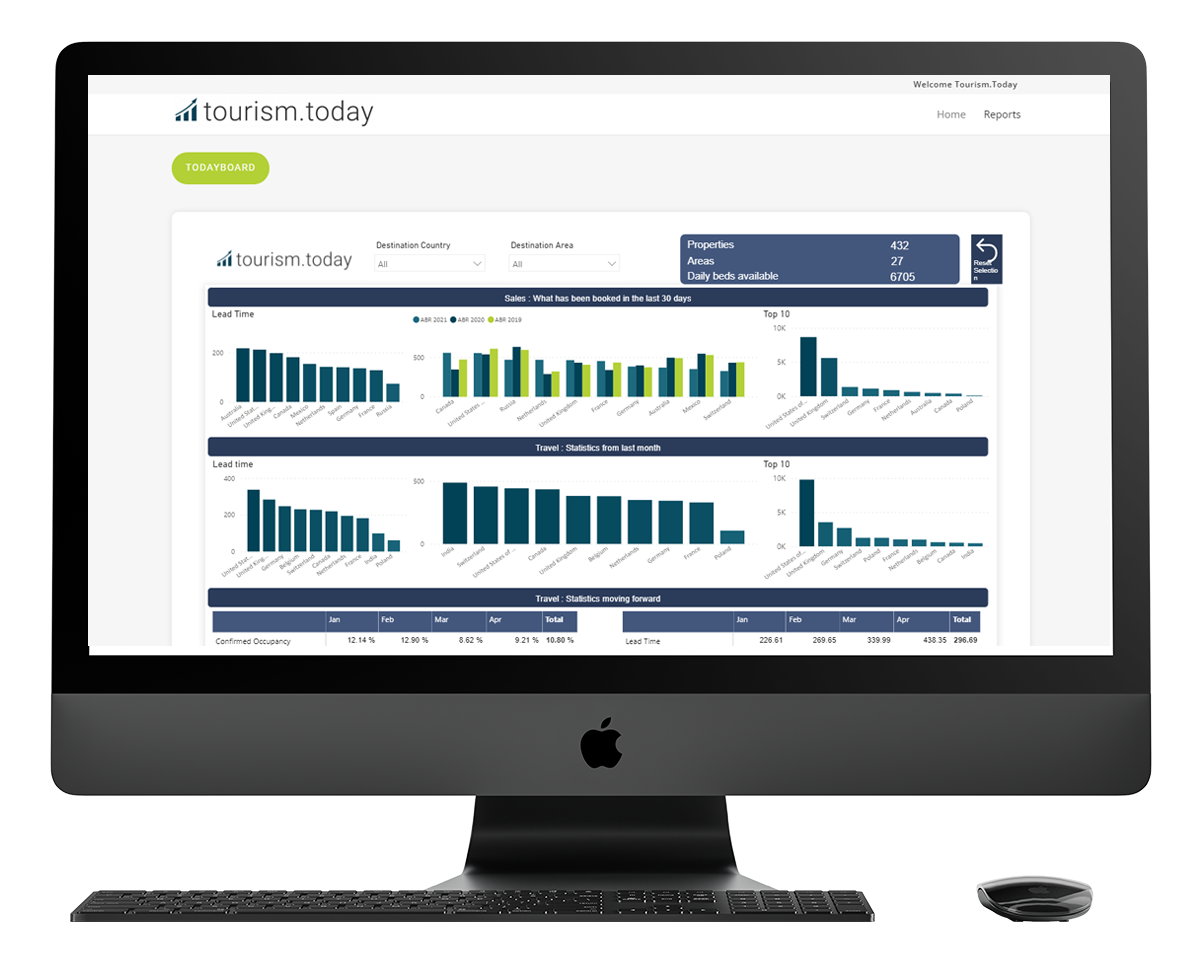
| Todayboard | ||||
| Travel Movements | ||||
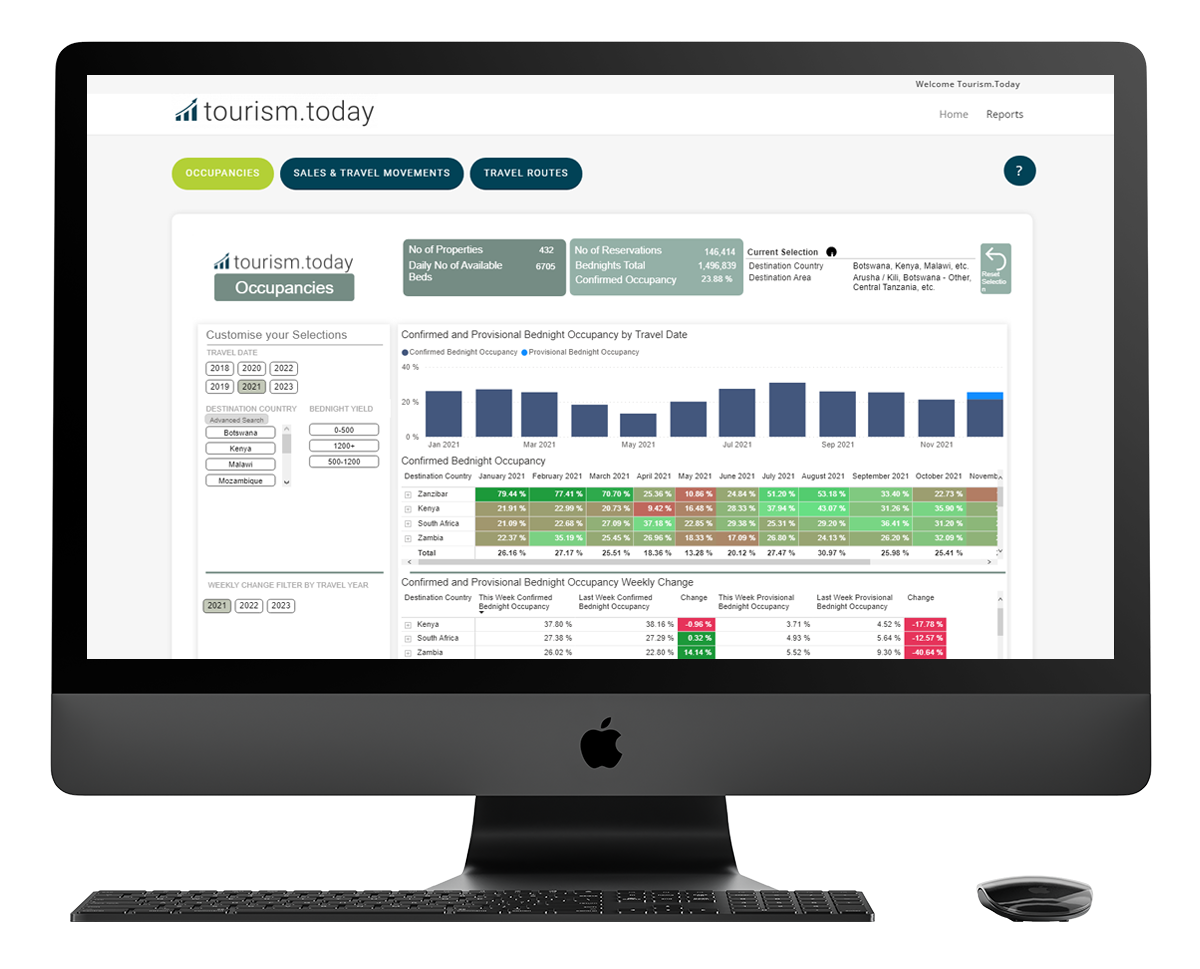
| Occupancies | ||||
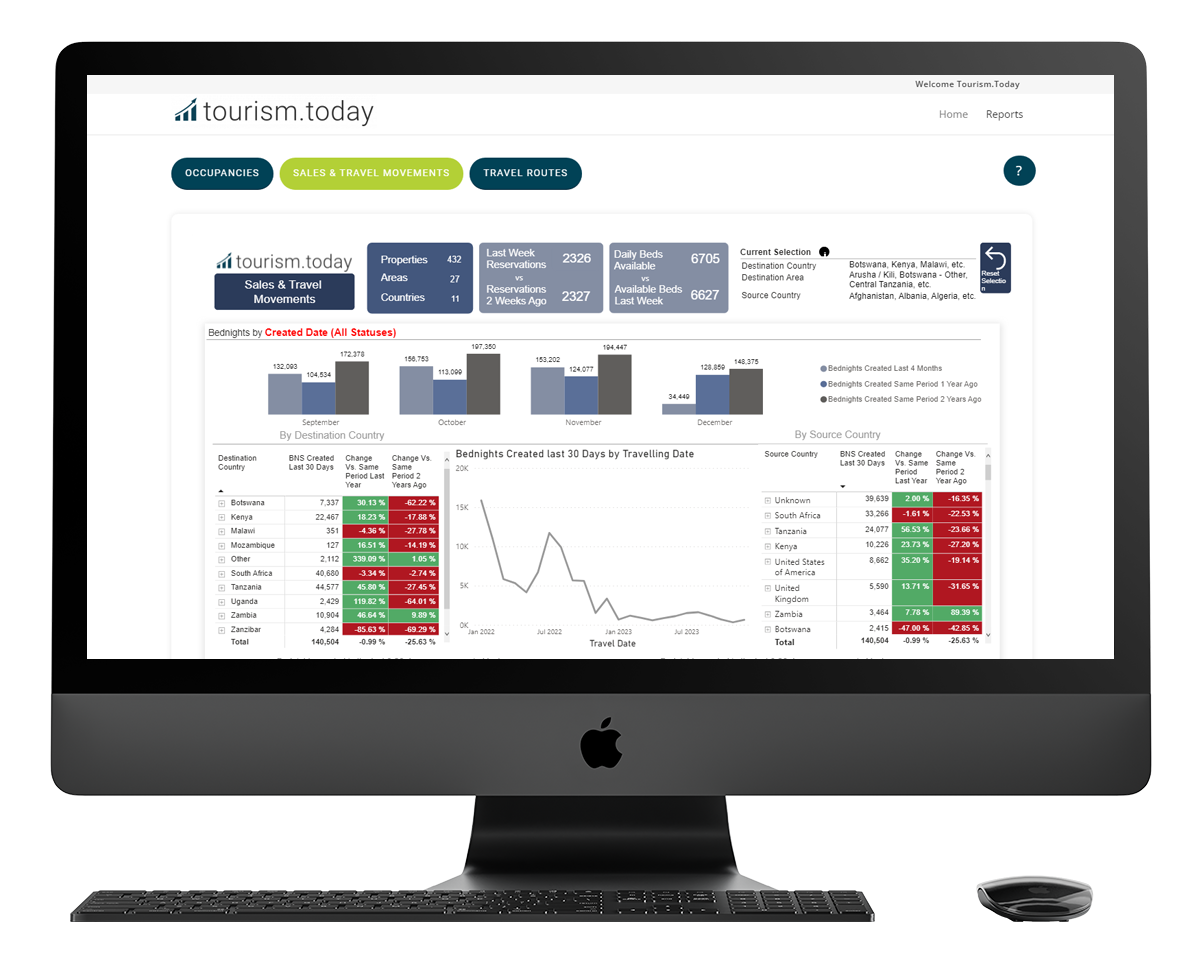
| Sales Movements | ||||
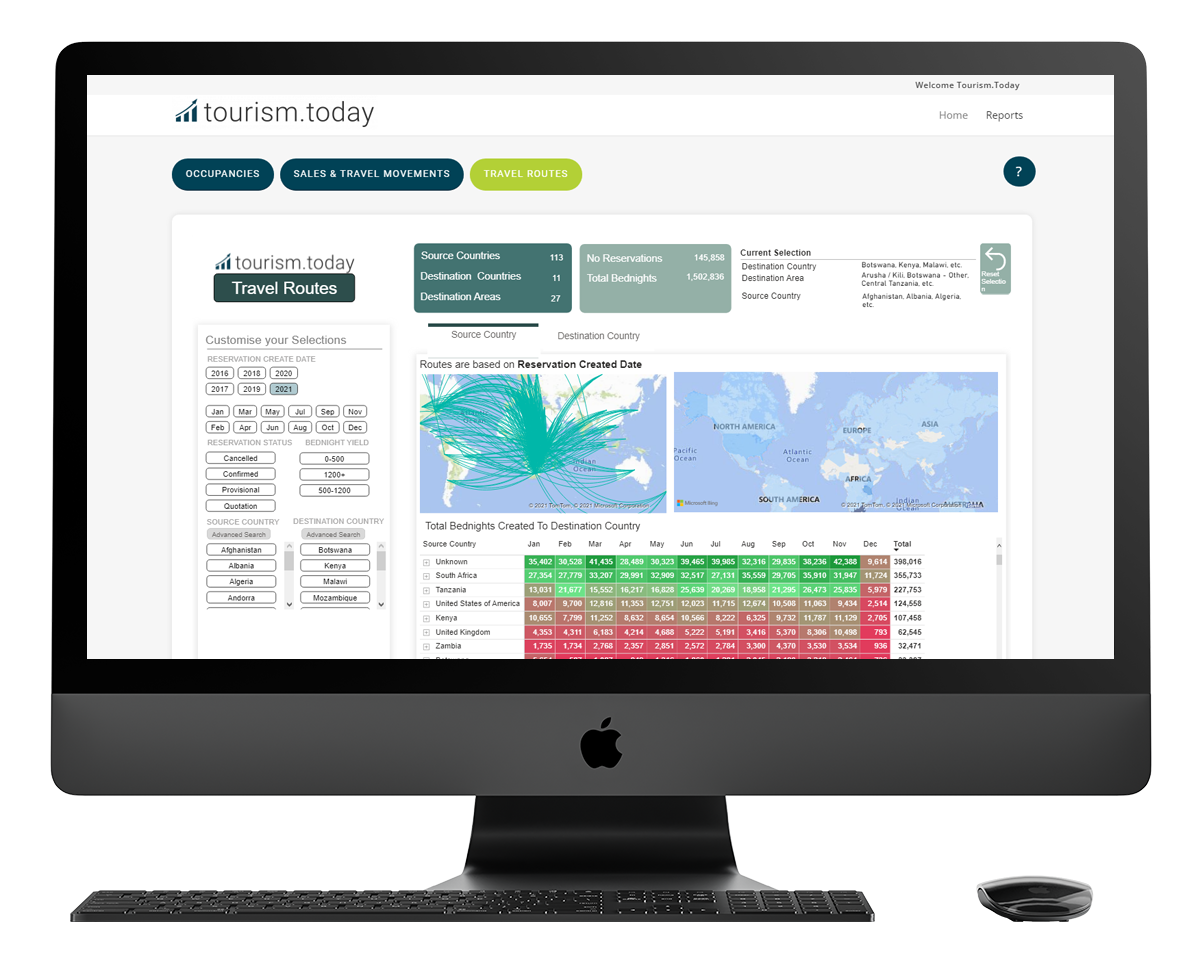
| Travel Routes | ||||
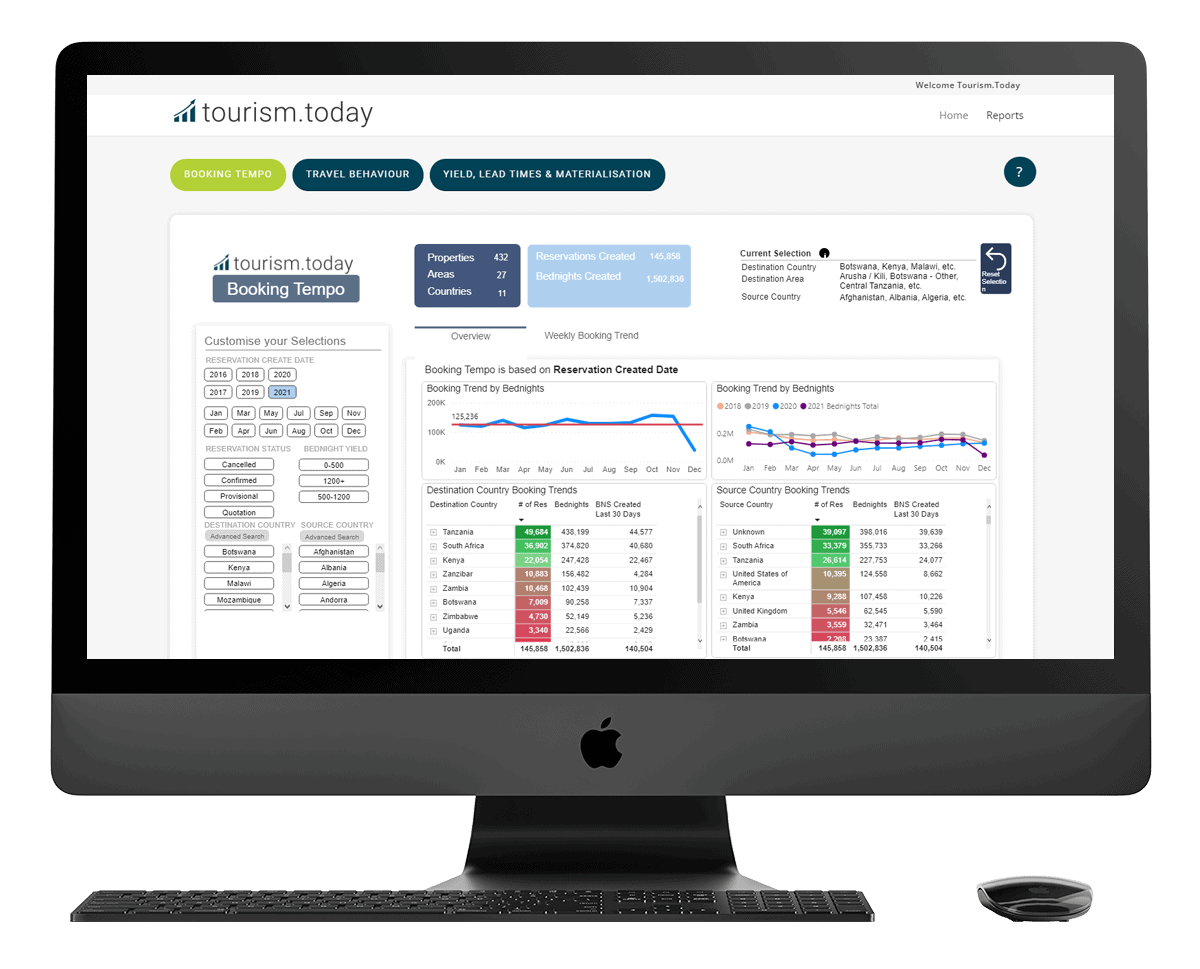
| Booking Tempo | ||||
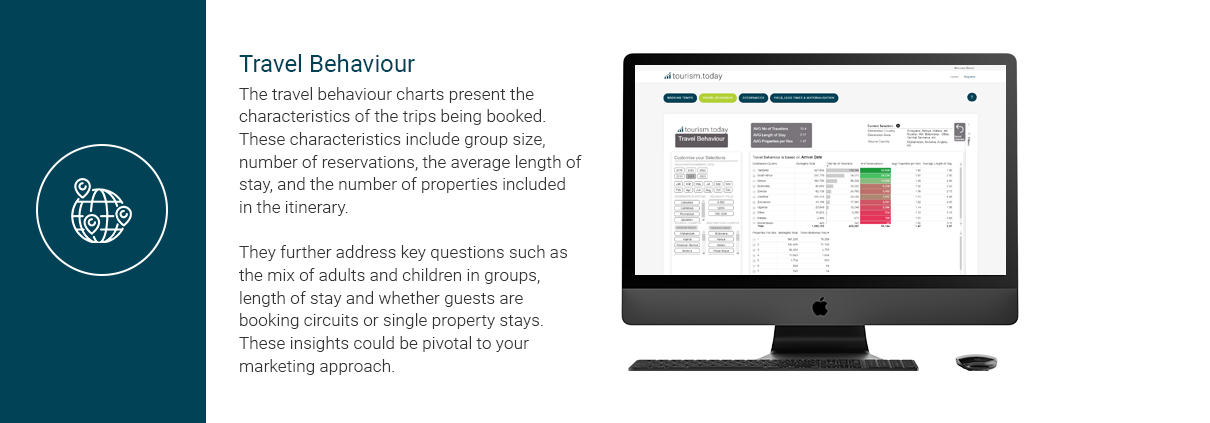
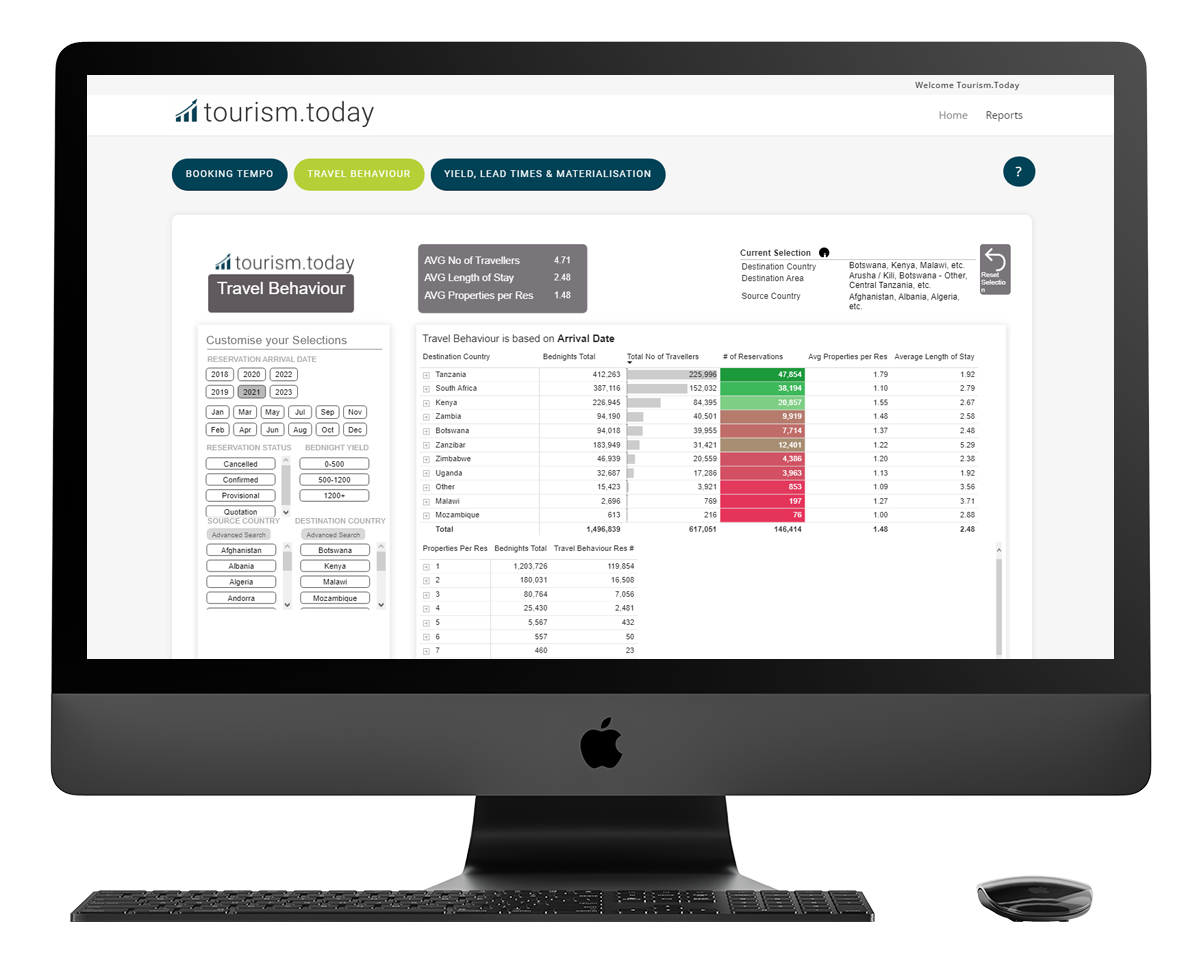
| Travel Behaviour | ||||
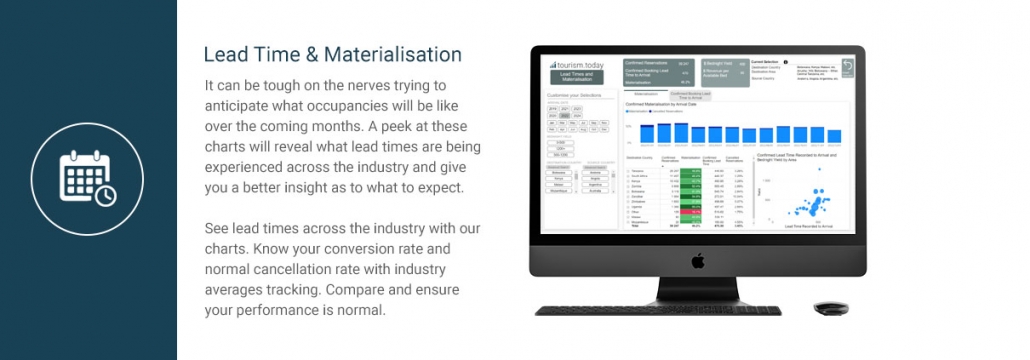
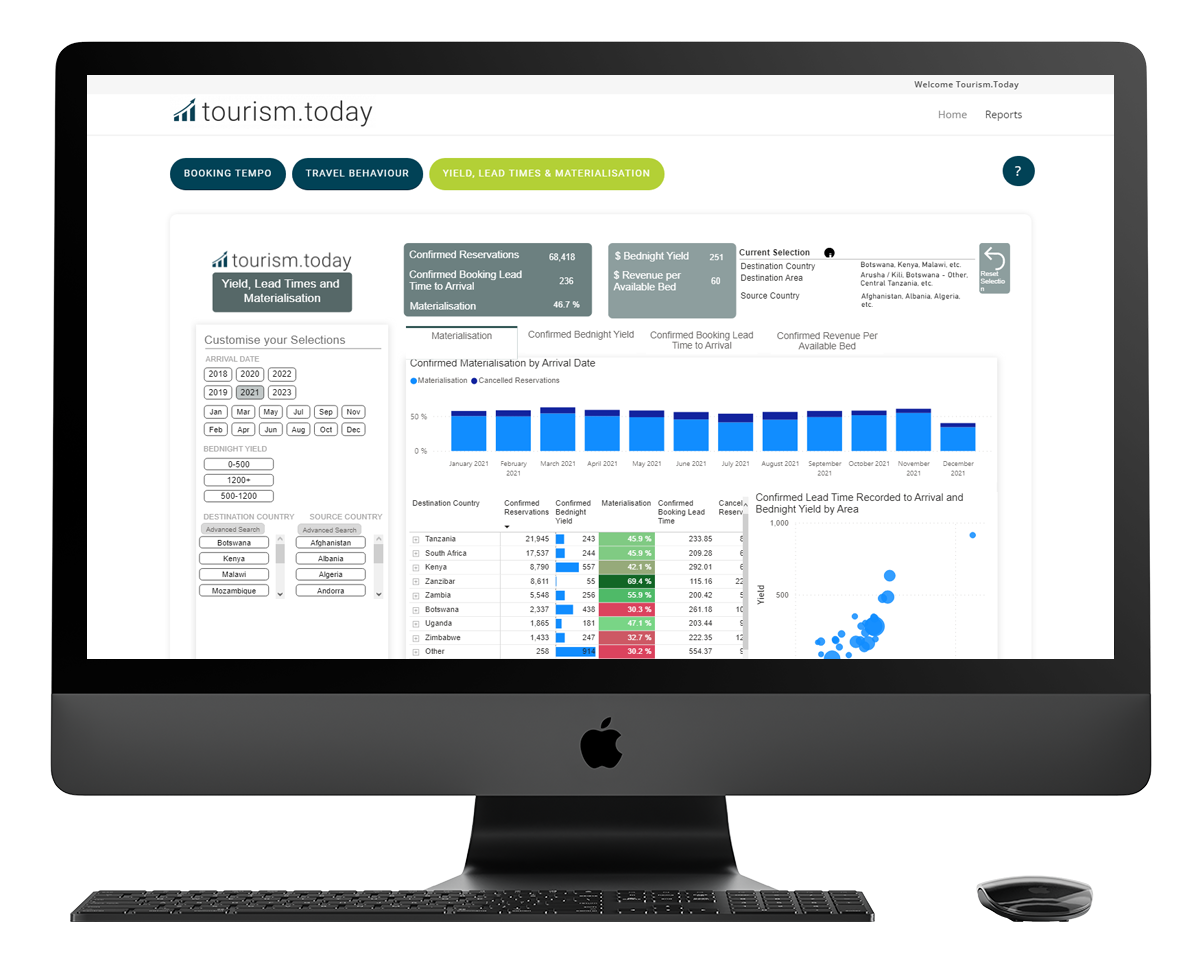
| Lead Time and Materialisation | ||||
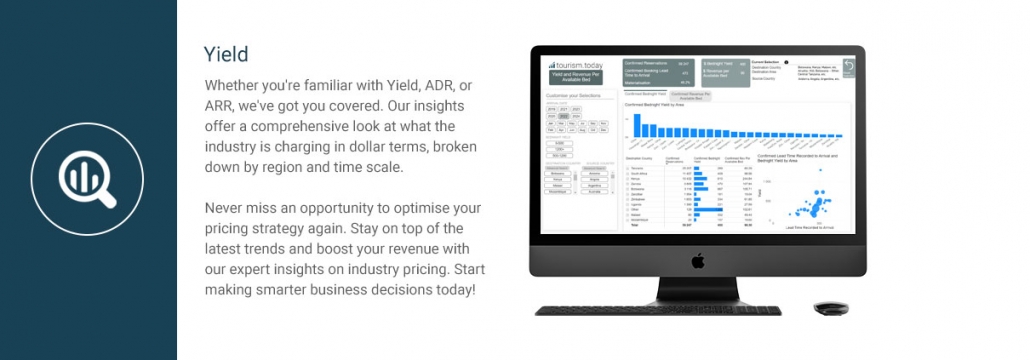
| Yield | ||||
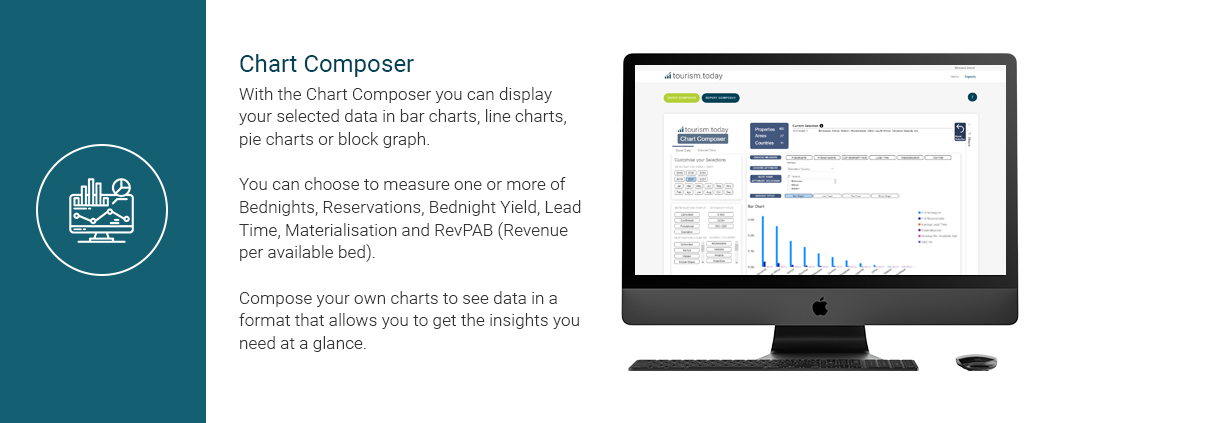
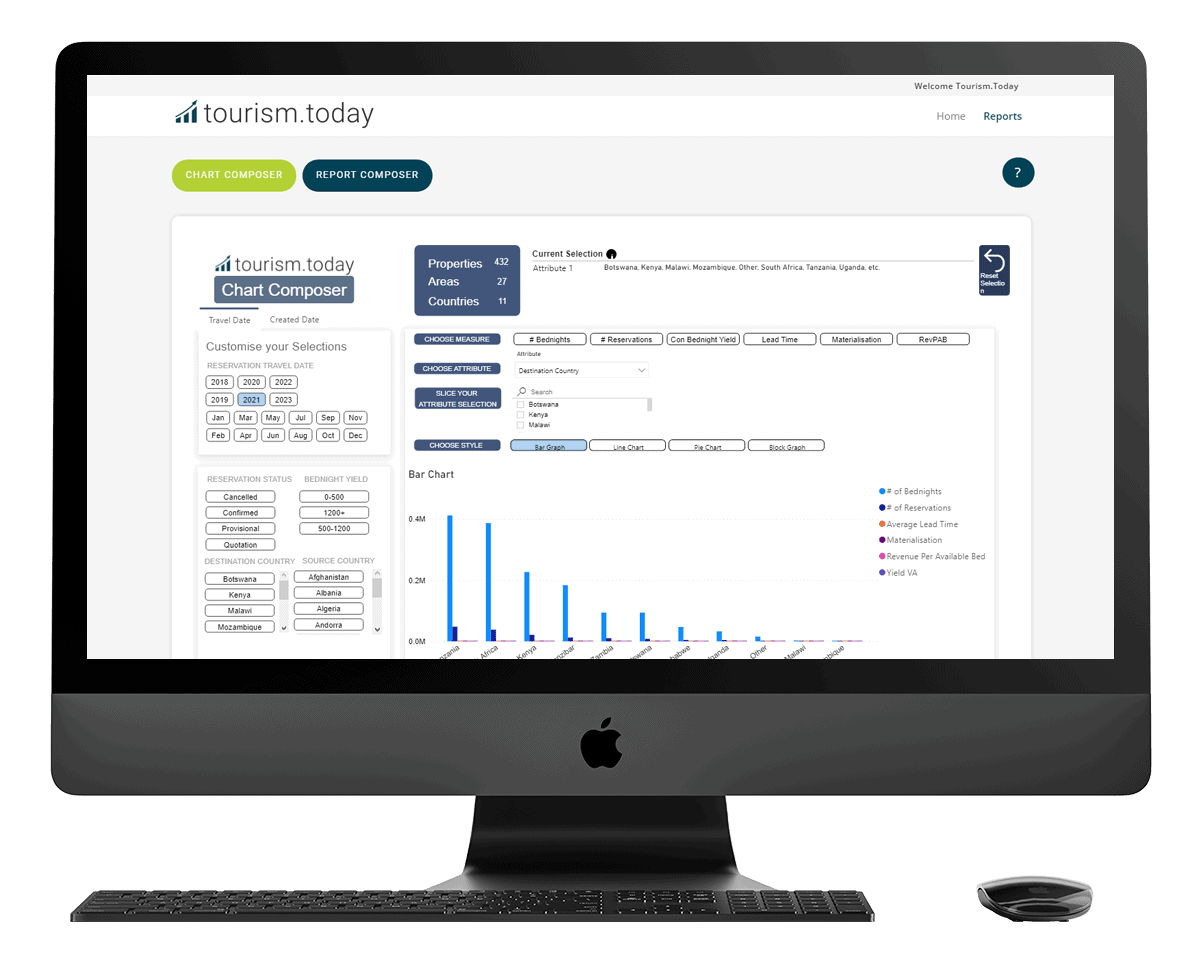
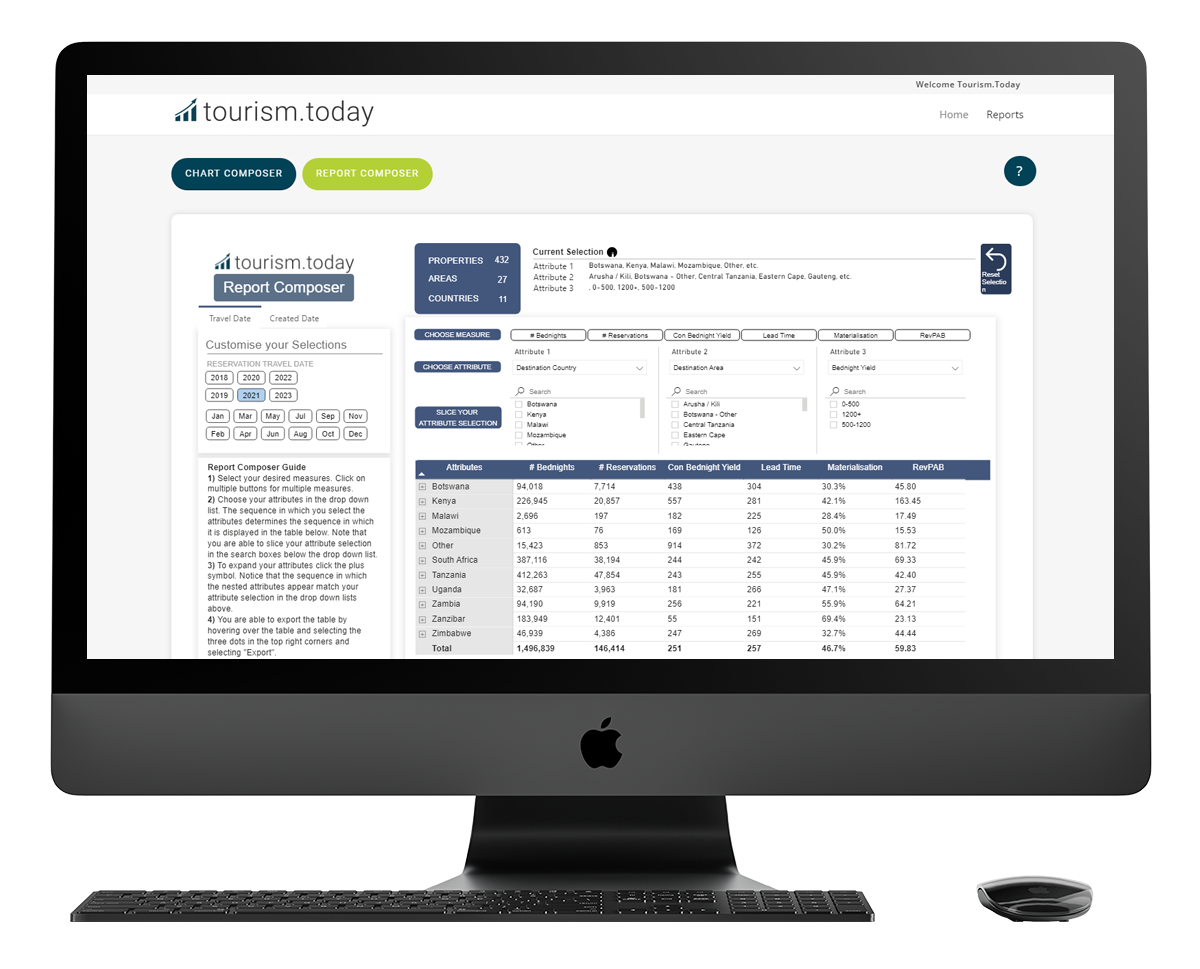
| Chart Composer | ||||
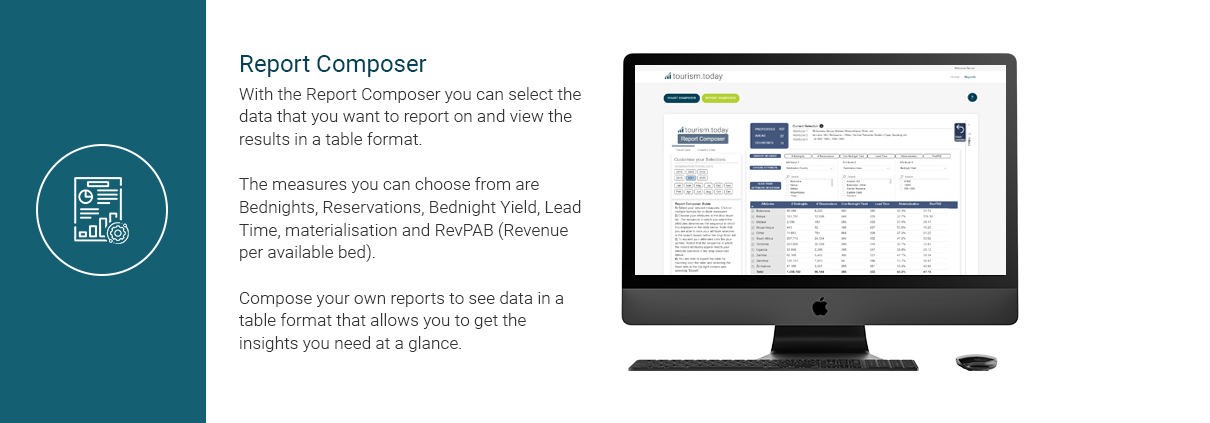
| Report Composer | ||||